The Big Book of Dashboards presents a comprehensive reference for those tasked with building or overseeing the development of business dashboards.
Available September 2025
A new book to help you build dashboards that make an impact. Dashboards That Deliver: How to Design, Develop, and Deploy Dashboards That Work teaches you a complete process of dashboard creation, from the initial spark, through discovery and prototyping, to release and maintenance.
The Big Book of Dashboards
Comprising dozens of examples that address different industries and departments (healthcare, transportation, finance, human resources, marketing, customer service, sports, etc.) and different platforms (print, desktop, tablet, smartphone, and conference room display) The Big Book of Dashboards is the only book that matches great dashboards with real-world business scenarios.
Authors

Steve Wexler
Data Revelations
Steve Wexler has worked with ADP, Gallup, Deloitte, Convergys, Consumer Reports, The Economist, ConEd, D&B;, Marist, Tradeweb, Tiffany, McKinsey & Company, and many other organizations to help them understand and visualize their data. Steve is a Tableau Zen Master, Iron Viz Champion, and Tableau Training Partner.
His presentations and training classes combine an extraordinary level of product mastery with the real-world experience gained through developing thousands of visualizations for dozens of clients. In addition to his recognized expertise in data visualization and Tableau, Steve has decades of experience as a successful instructor in all areas of computer-based technology. Steve has taught thousands of people in both large and small organizations and is known for conducting his seminars with clarity, patience and humor.
DataRevelations.com
@VizBizWiz

Jeffrey Shaffer
Data Plus Science
Jeffrey Shaffer is the Director of the Applied AI Lab, the Kirk and Jacki Perry Professor of Analytics, and Assistant Professor-Educator at the Lindner College of Business in Operations, Business Analytics and Information Systems where he was awarded the 2025 Michael L. Dean Excellence in Classroom Education and Learning Graduate Teaching Award.
He previously served as the Chief Operating Officer and Vice President of I.T. and Analytics at Unifund and Recovery Decision Science. He is one of thirty people in the world inducted into the Tableau Visionary Hall of Fame, hosts the award-winning podcast Chart Chat, and is the Co-Author of The Big Book of Dashboards and the upcoming book Dashboards That Deliver.
DataPlusScience.com
@DataPlusScience

Andy Cotgreave
Tableau Software
Andy Cotgreave is co-author of The Big Book of Dashboards, and Technical Evangelist at Tableau. He is the host of If Data Could Talk, co-host of Chart Chat and columnist for Information Age. He has over 15 years’ experience in data visualisation and business intelligence, first honing his skills as an analyst at the University of Oxford. Andy helps customers, media and analysts across all industries see and understand their data. He has inspired thousands of people with technical advice and ideas on how to identify trends in visual analytics and develop their own data-discovery skills.
GravyAnecdote.com
@acotgreave
Broad Application
Healthcare
Scheduling, patient tracking, worker's compensation claims, and health care provider productivity monitoring.
Customer Service
Call center dashboard, complaint monitoring, now vs. then comparisons and customer churn.
Marketing
Website tracking, resource utilization and sentiment analysis.
Sports
Team performance analysis and player performance rating.
AUTHORS
CONTRIBUTORS
DASHBOARDS
PAGES
Real-world examples
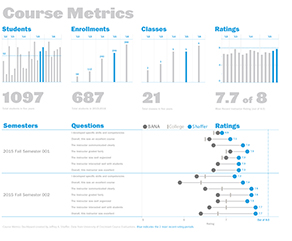
Course Metrics Dashboard
This dashboard monitors the metrics of a course at a university.
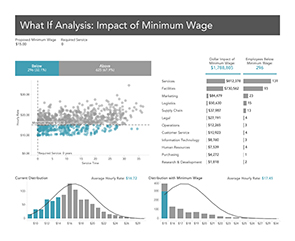
What-If Dashboard
What-If Dashboard that analyzes the impact of increasing the minimum wage within an organization.
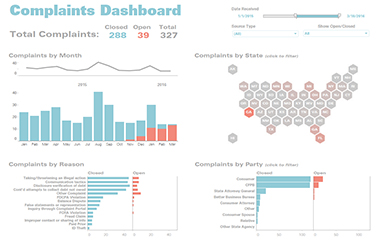
Complaints Dashboard
A dashboard used to monitor consumer complaints by channel that are open and closed.